NEUROSONIC INSIGHTS (BETA)
Recovery made visible
What you feel is now seen in data.
Neurosonic Insights helps you understand how sleep, stress, and recovery change in your everyday life, and how your Neurosonic use is reflected in your metrics.
Insights brings key wellbeing metrics into a single view and supports following both daily values and longer-term trends.
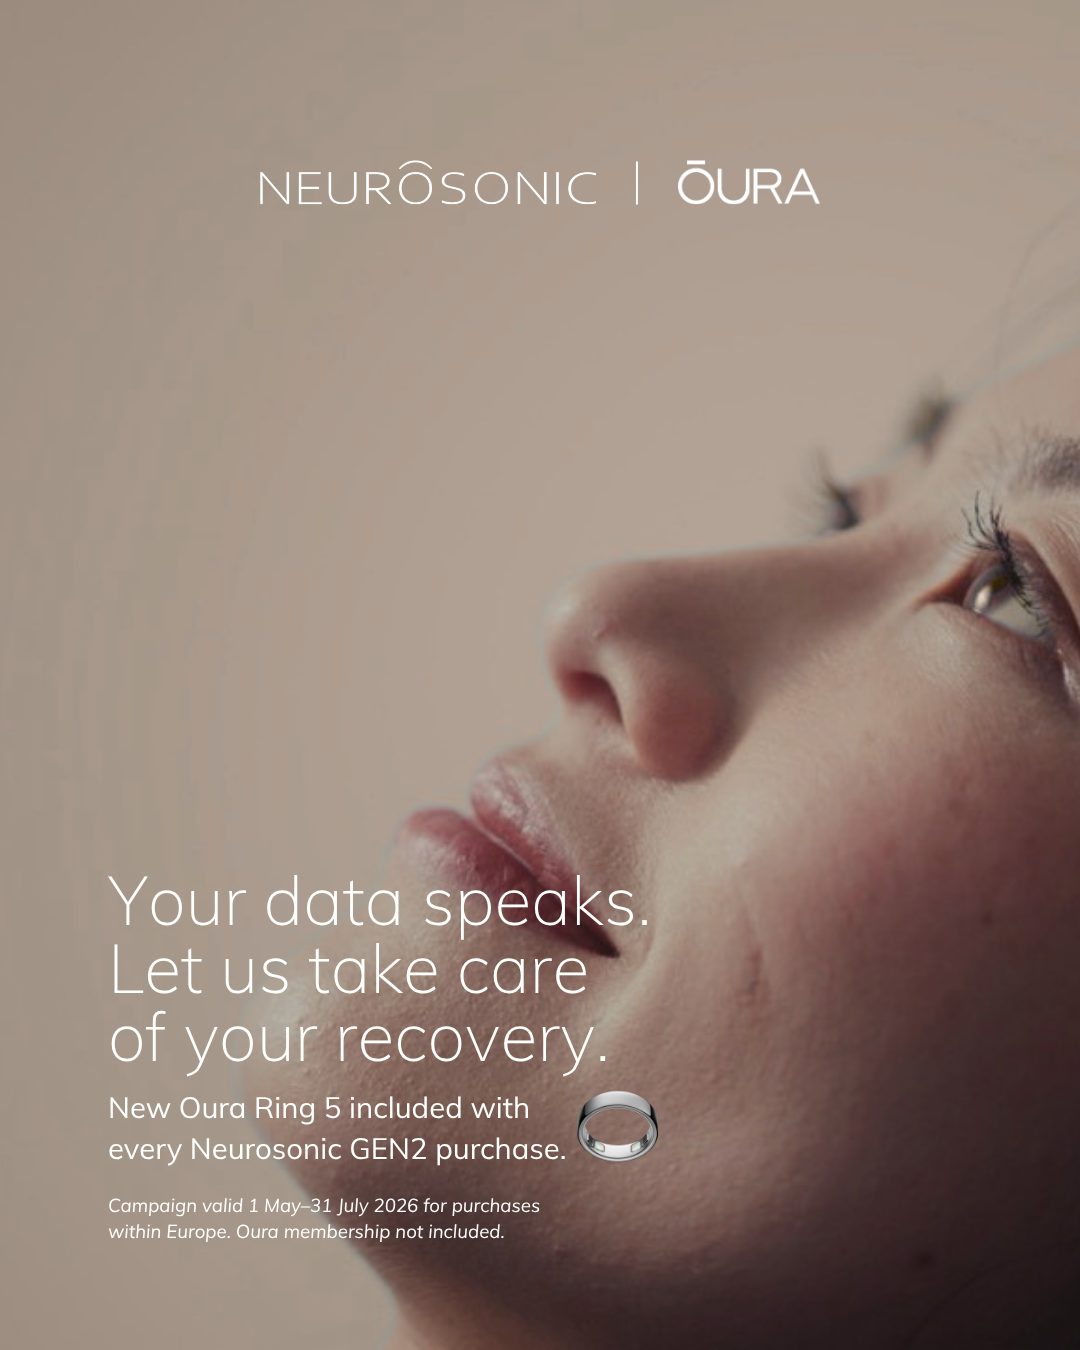
Note: Neurosonic Insights is a wellbeing feature and not a medical diagnostic tool. The metrics are based on assessments provided by connected services (such as Oura).
Neurosonic Insights is currently in beta and is being continuously developed.
Quick start guide for Neurosonic Insights:
- Connect a service provider: Open Settings in the app, go to Neurosonic Insights, and add a service such as Oura. Accept the requested permissions.
- Sync your data: In Insights settings, you’ll see Last data sync. Refresh the sync using the sync button if needed.
- Start exploring: Go to Insights in the app. In the Day view, see today’s averages and sleep data. Use the Month view to explore trends and the Difference comparison.
Understanding your Neurosonic Insights data

DAY VIEW
What happened in your body today?
You’ll see three key average metrics:
- Heart rate (bpm)
Your average heart rate for the day. A lower and more stable heart rate is often associated with good recovery and basic fitness. - HRV (ms)
Heart rate variability. A key indicator of recovery and stress tolerance. Higher HRV often reflects better adaptation to physical and mental load. - Stress level (level)
An estimate of how much strain your body experienced during the day.
The percentage shown at the bottom of the card (for example, “2% better than your recent average”) indicates how the day compares to your own recent baseline.

SLEEP DATA
Sleep and sleep stages
The Sleep Data section shows:
- Total sleep duration
- Light sleep (often the largest portion of the night)
- Deep sleep (the most restorative stage)
- REM sleep (an active stage when dreaming typically occurs)
Tip: Try not to focus too much on a single night. When it comes to sleep, trends are often more meaningful than day-to-day variation.

MONTH VIEW
Comparison view
The Month view summarises data for the selected period (for example, “January 2026”). This view makes it easiest to see the overall direction of your wellbeing.
Key metrics for the selected period
You can switch between four views:
- All days
Shows averages for the entire period, including both days with and without Neurosonic use. - Usage days
Shows averages only for days when the Neurosonic device was used. - No usage
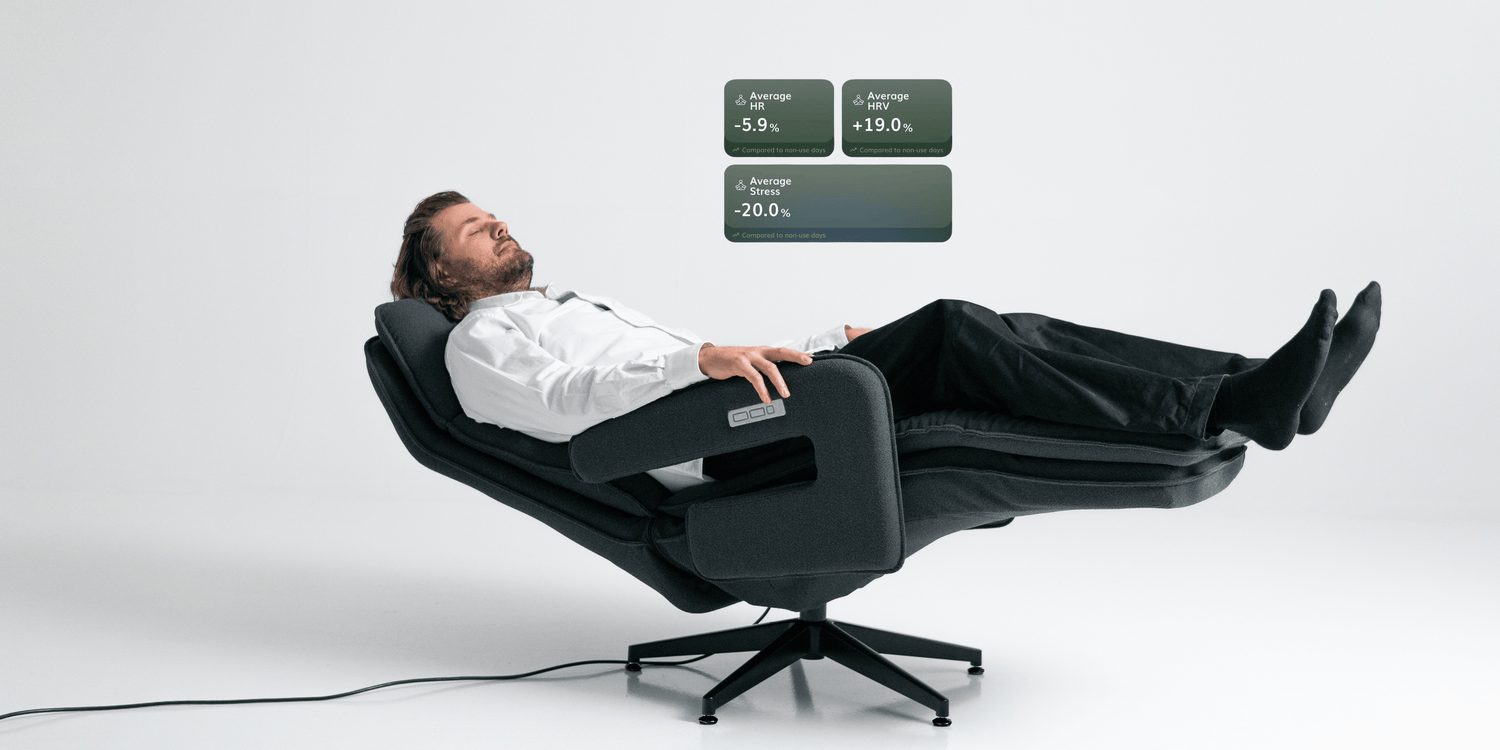
Shows averages for days when the device was not used. - Difference
Shows how values differ between usage days and non-usage days. This can help you observe whether Neurosonic use is reflected in your wellbeing data (for example, sleep- or stress-related metrics).
Tip for interpretation:
The Difference view is most useful when the selected period includes enough both usage and non-usage days.

Neurosonic summary
What happened during the session?
The Neurosonic summary shows how a single Neurosonic session is reflected in your wellbeing data. It displays heart rate, HRV, and stress level:
- Before Neurosonic
Values measured at the start of the session - During Neurosonic
Changes observed during the programme - After Neurosonic
Values measured immediately after the session, reflecting the body’s immediate response
This view helps you observe how your body responds during and right after a selected programme, and assess how well it fits into your routine.
If a metric shows “–”, data was not available for that moment (for example, the measurement was missing or the signal quality was insufficient).

Making the most of Insights
Make tracking a routine
Check the Day view once a day and the Month view once a week.
Assess impact through trends
Individual days can fluctuate. The overall direction is usually more meaningful.
Try a “mini test”
- Choose a period of 2–4 weeks
- Keep your bedtime and daily rhythm as consistent as possible
- Use Neurosonic on some days and skip it on others
- In the Month view, review the Difference view and Neurosonic summaries to see how the metrics behave
Frequently asked questions (FAQ)
We’ll continue to add and update questions and answers as Neurosonic Insights evolves.
Why isn’t my data visible?
Make sure you’ve connected a service provider (Settings → Neurosonic Insights) and that your data sync is up to date.
Why doesn’t “Difference” make sense?
The Difference view works best when there are enough days with and without use. Unusual strain such as travel, alcohol, illness, or increased training can influence the data.
Why does HRV or stress show “–”?
Not every moment produces a reliable measurement. This is normal. Focus on the overall picture and longer-term trends.
Wellbeing starts here
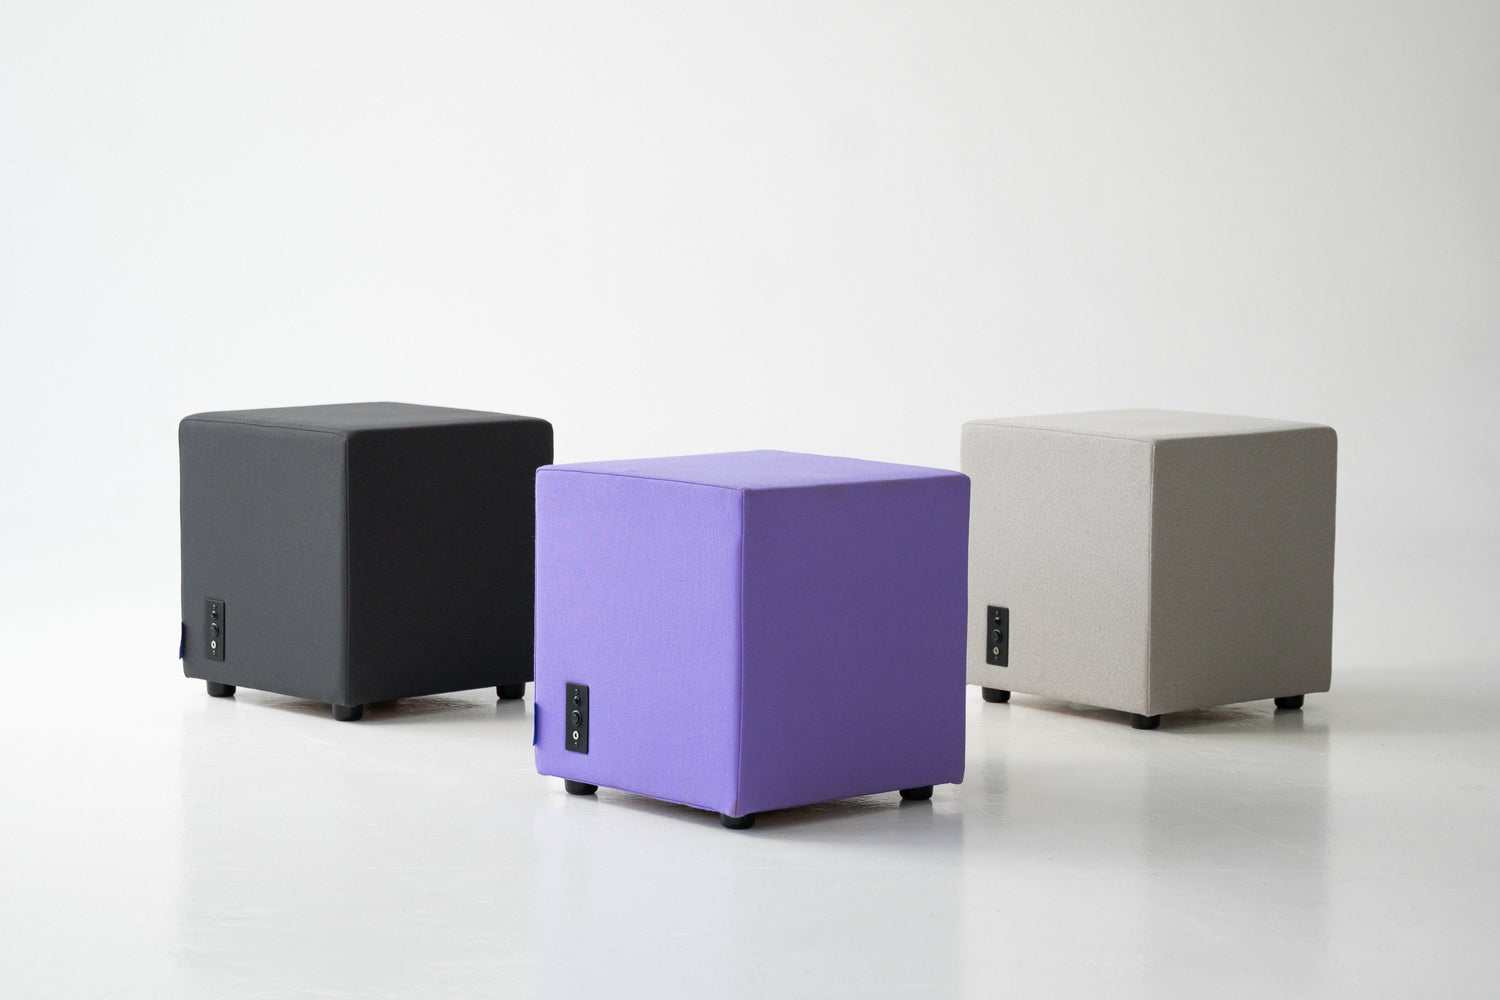

Neurosonic Cube
Neurosonic Harmonia
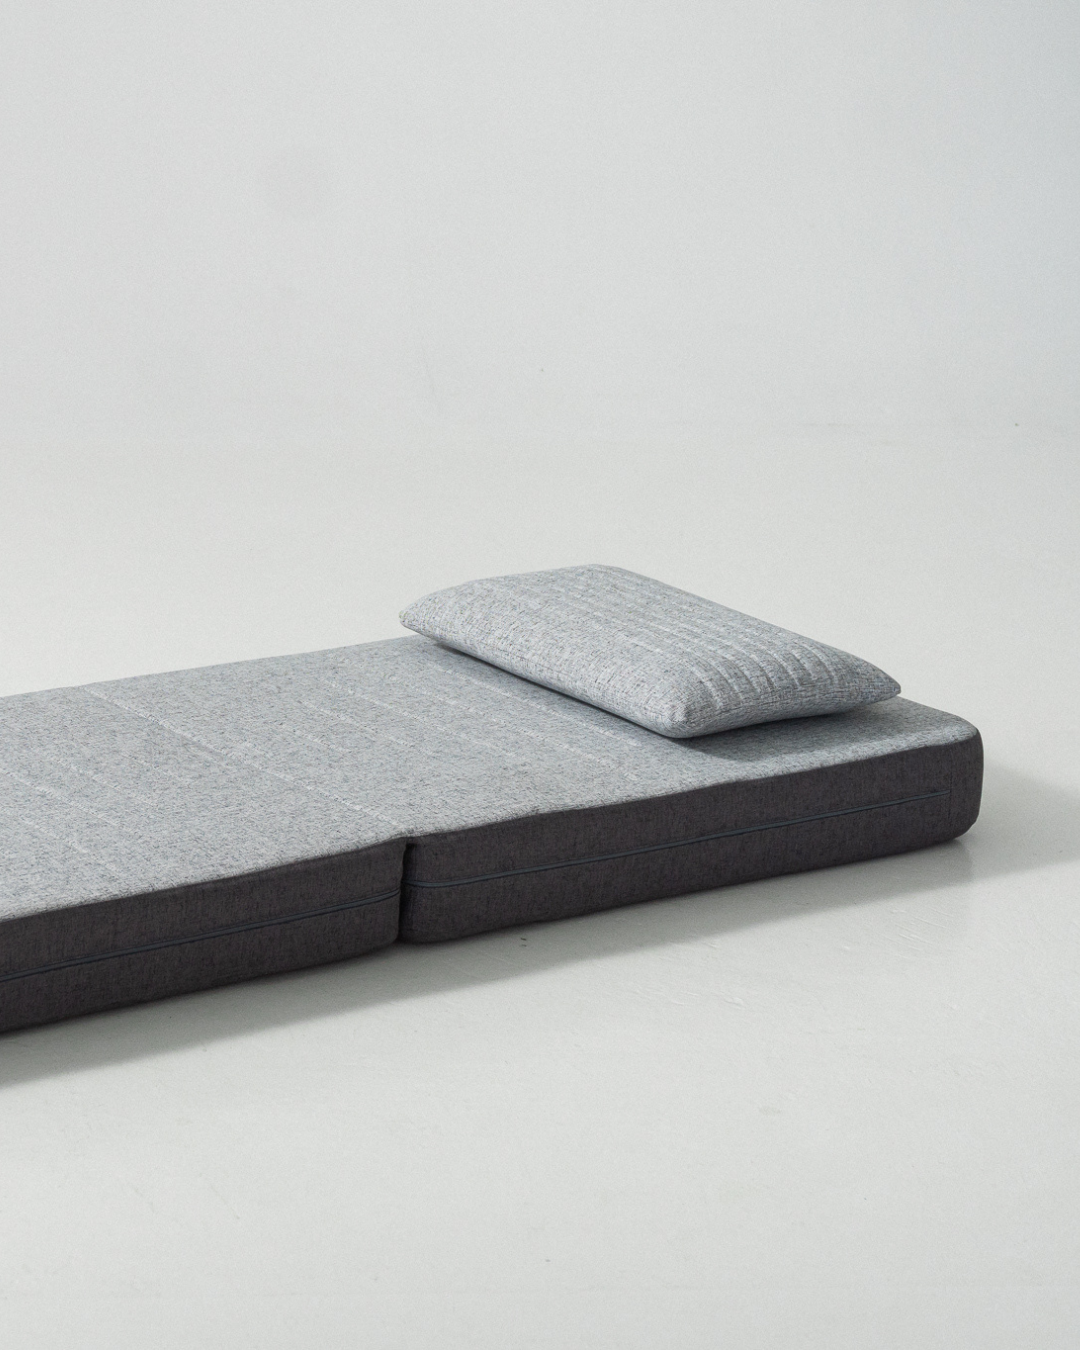
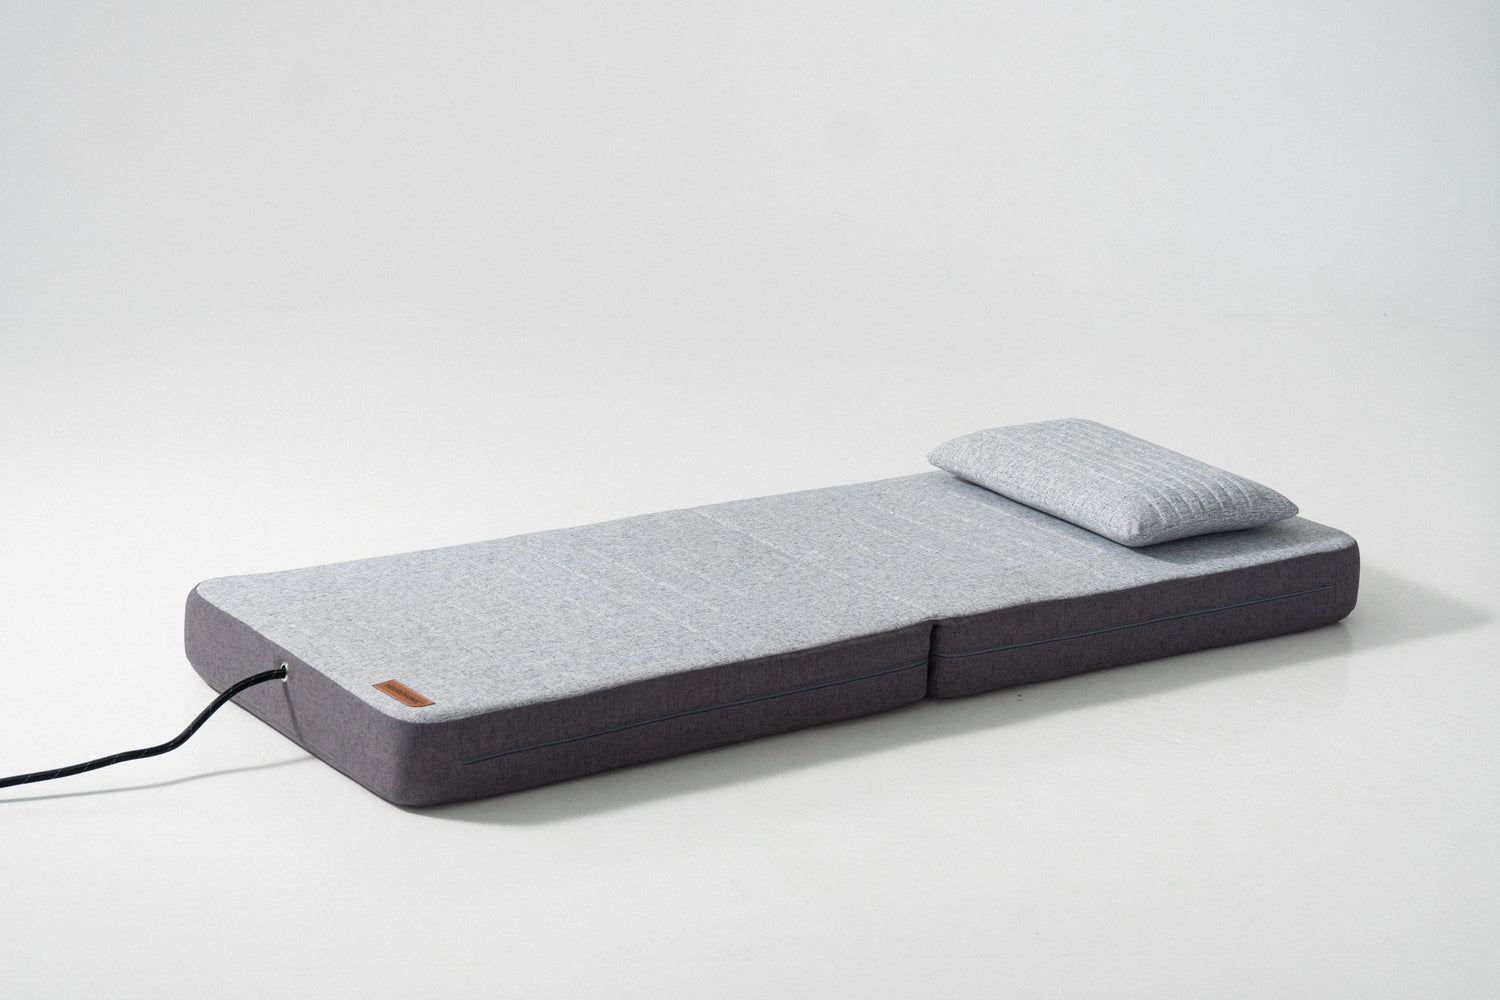
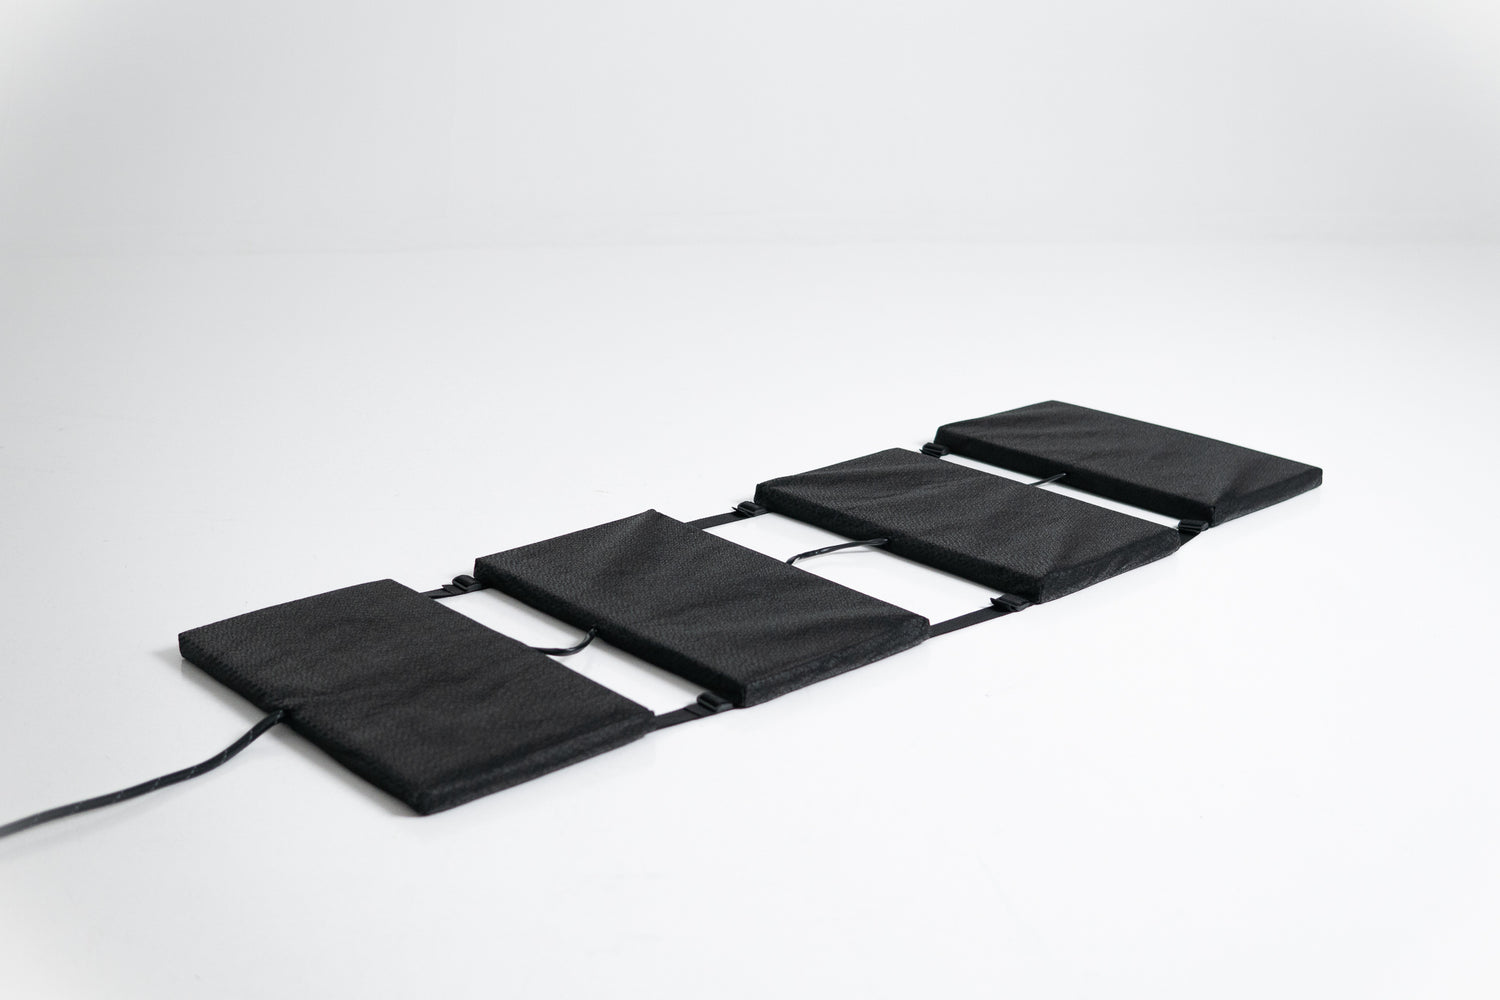
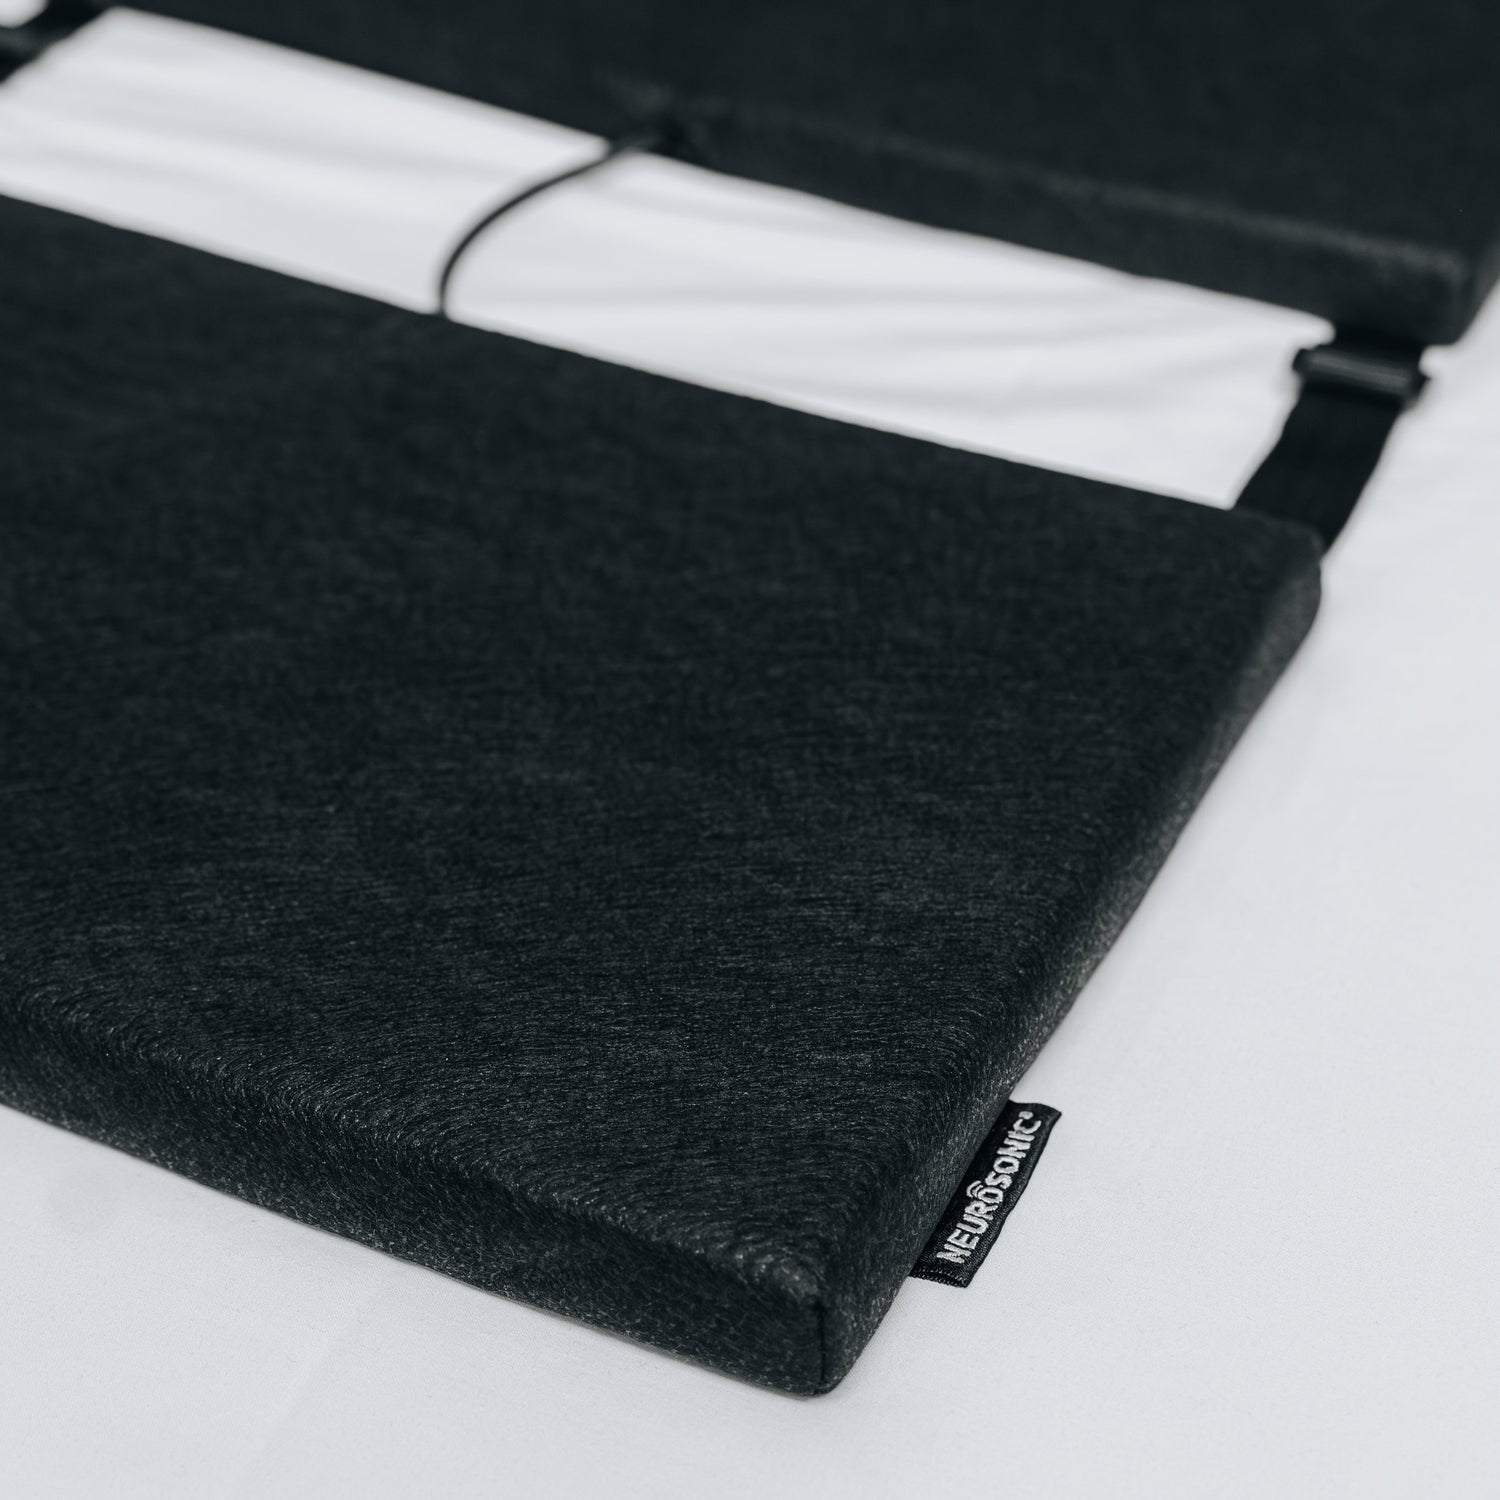
Neurosonic Mobile Mattress Gen2
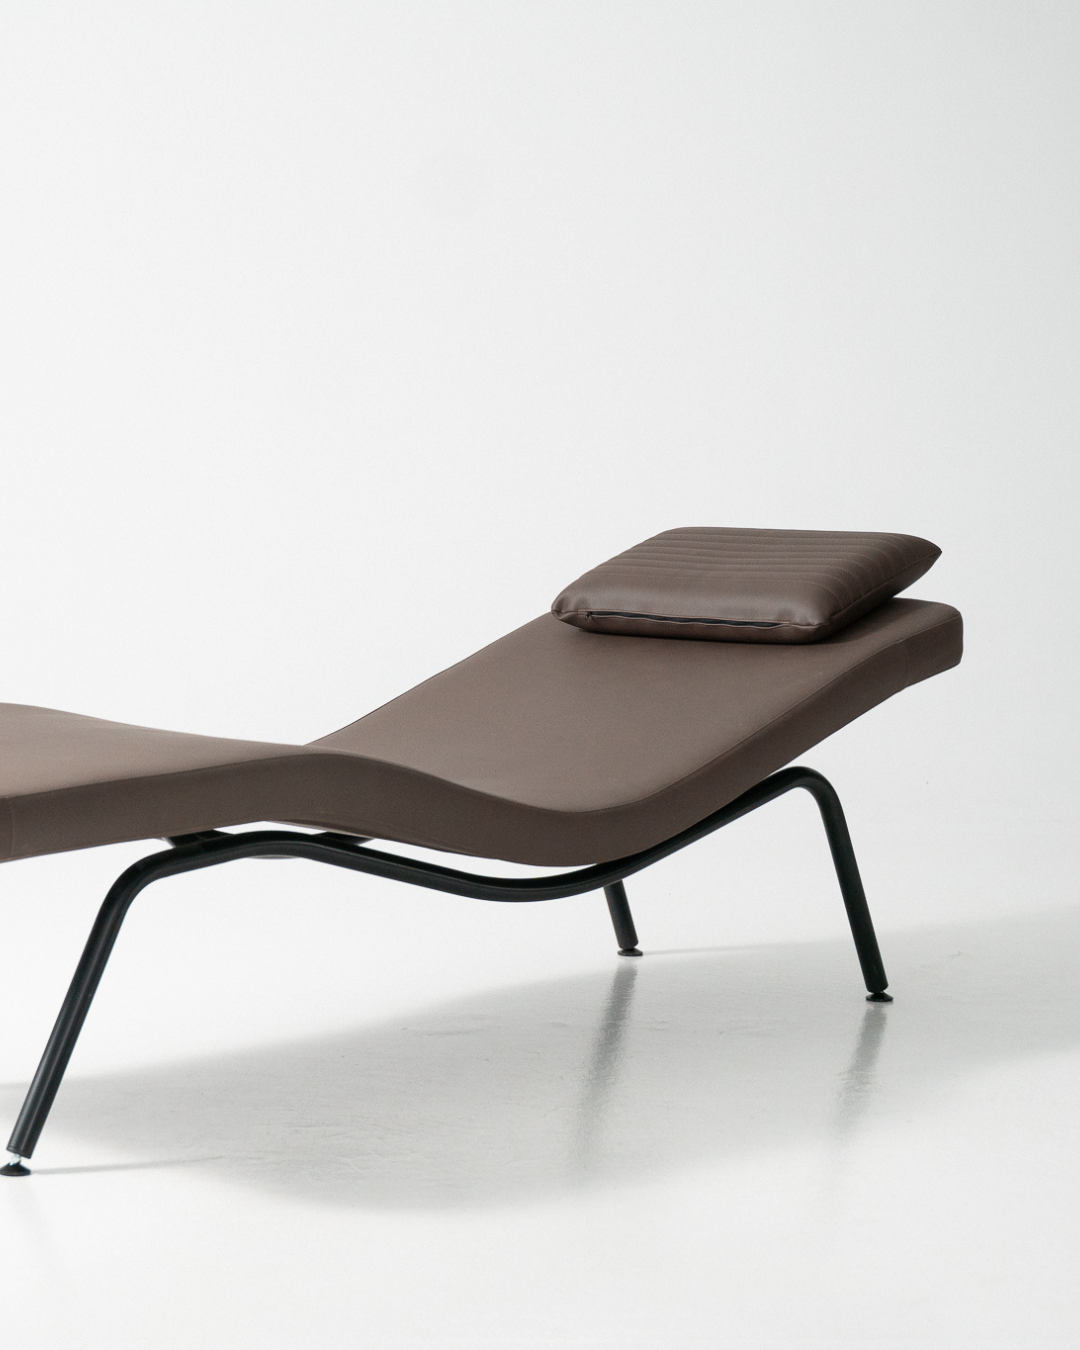
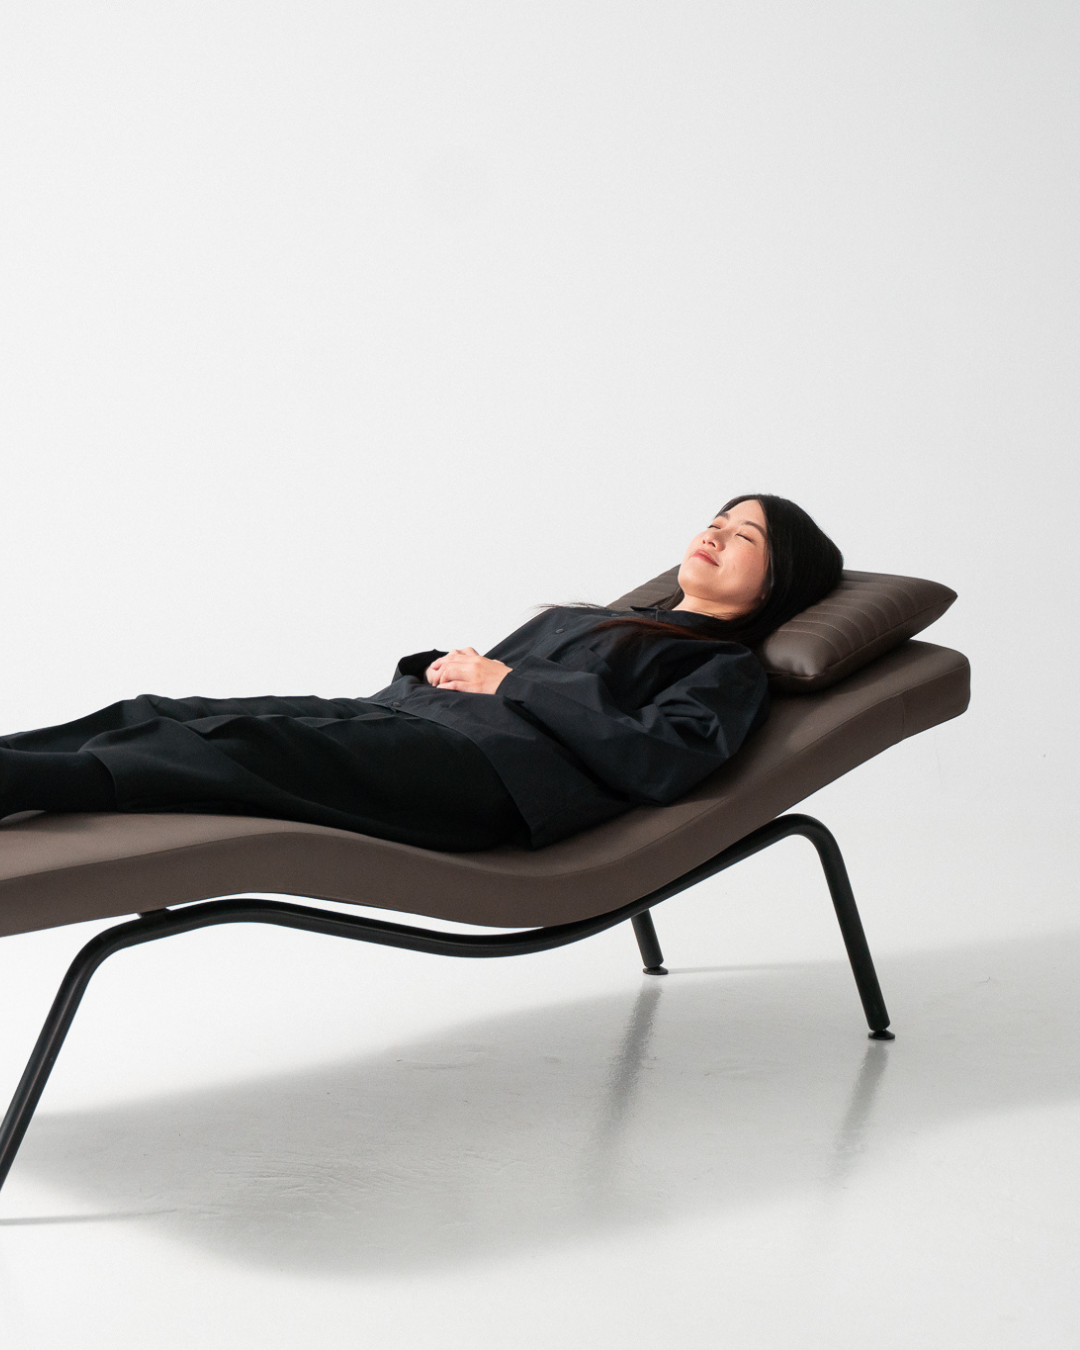
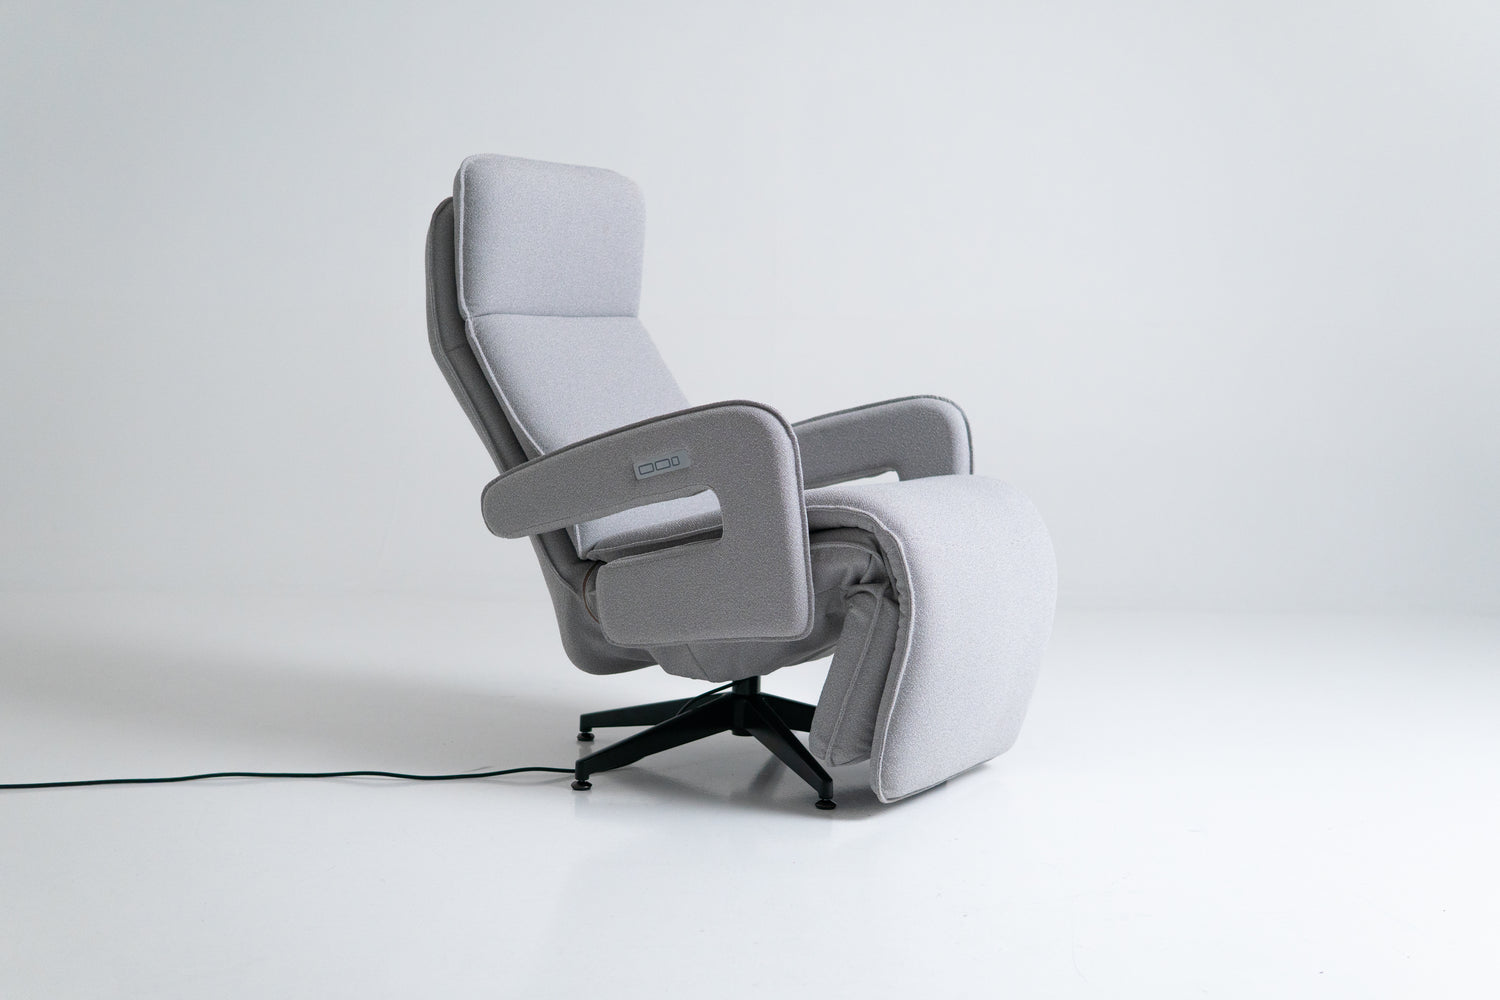
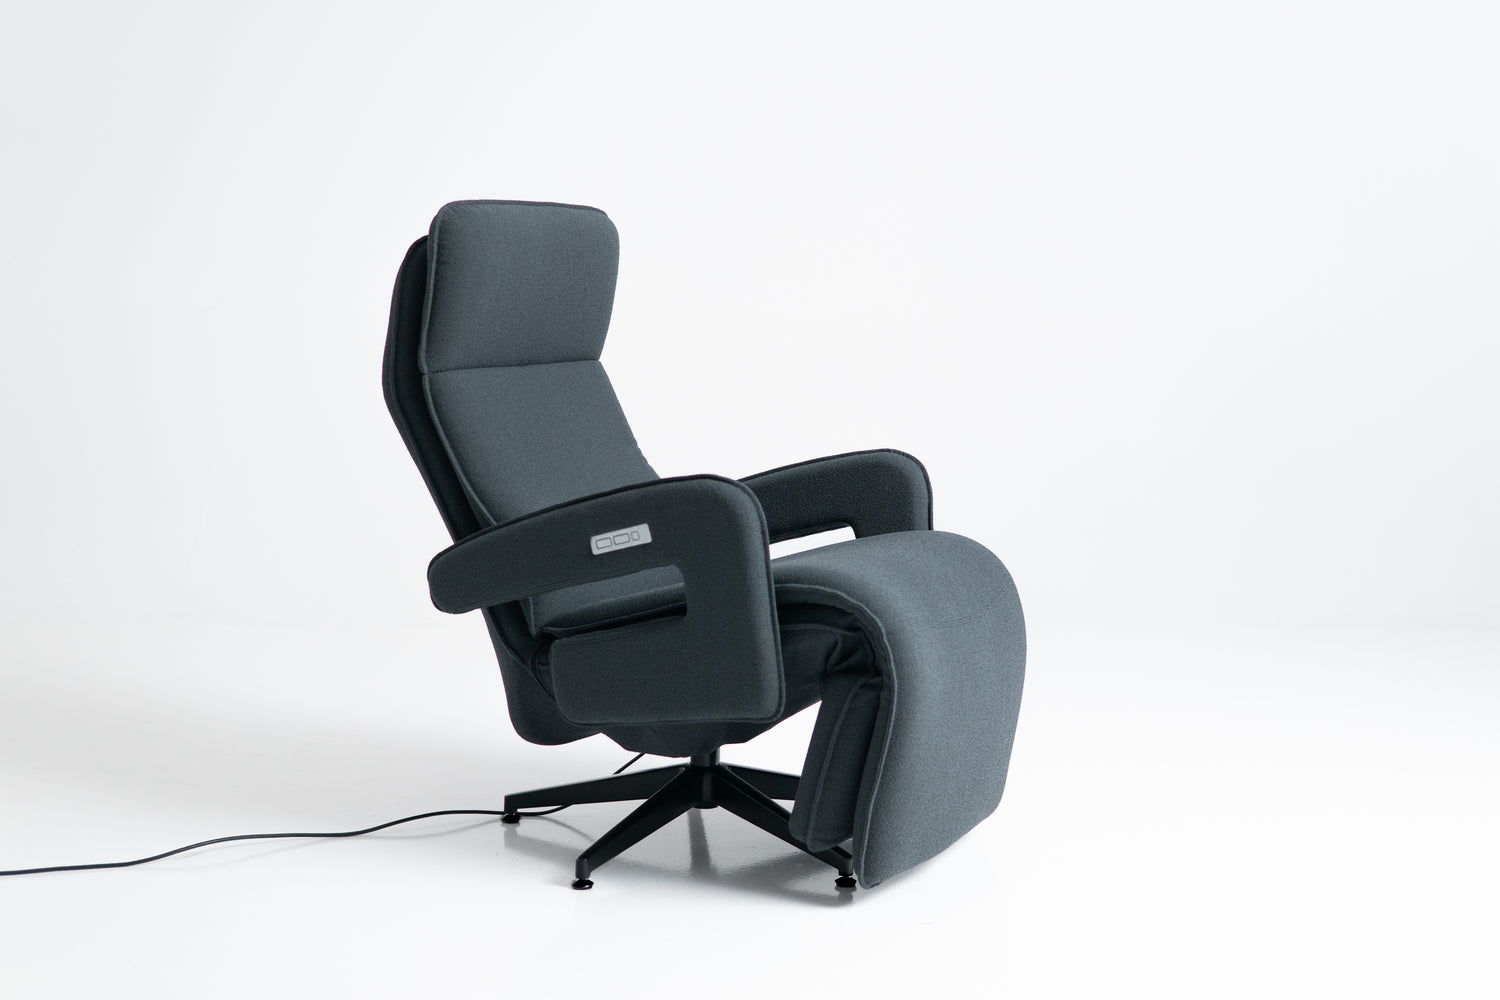
Neurosonic Chaise Longue Gen2